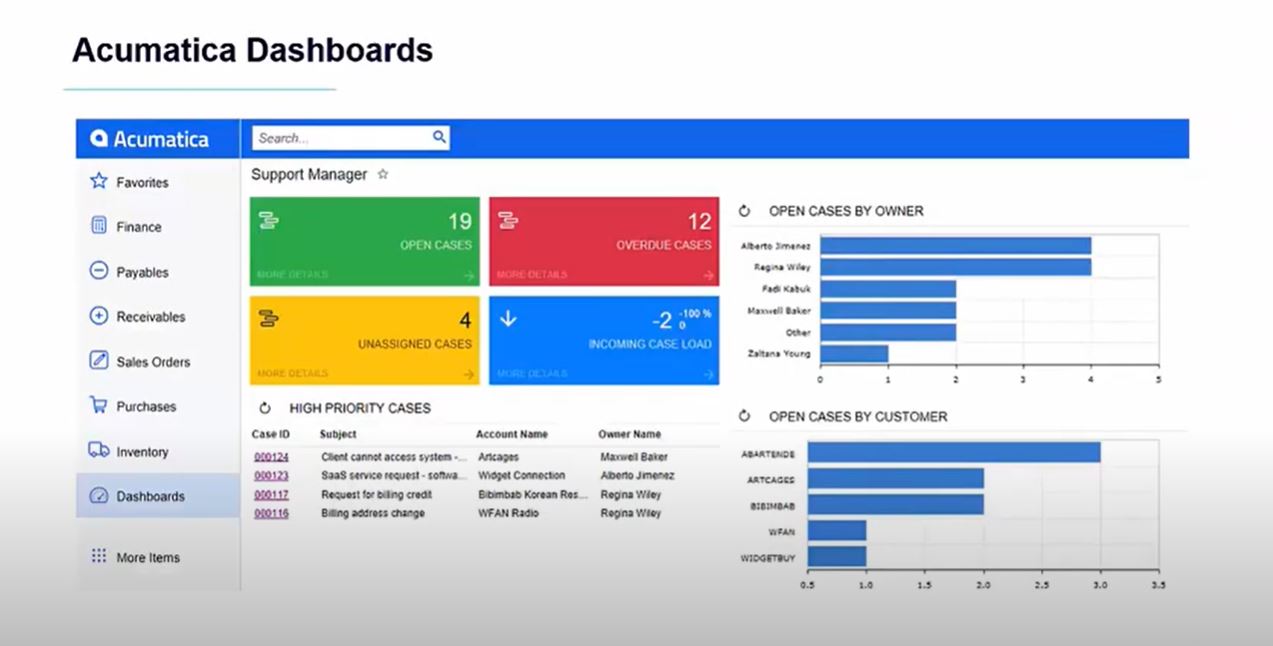
This quick video demo of Acumatica’s dashboards and KPI (key performance indicators) capabilities will show you how easy it is to capture the visibility you need at a glance or by drilling down through each level of Generic Inquiry in your cloud ERP. Watch the video or continue reading the transcript below to learn more:
Acumatica: Dashboards & KPI Overview Transcript
Acumatica Cloud ERP – Dashboards and Key Performance Indicators.
With Acumatica’s dashboards, all users in your company can monitor financial operational and organizational information while analyzing real-time trends that relate to their role in the company.
Each small component on an Acumatica dashboard is called a widget and with the appropriate permissions you can modify these widgets to display the needed information depending on your role and responsibilities.
For example, a financial controller’s dashboard is focused on the financial aspects of the business, while an inventory or purchasing manager’s dashboard typically includes data related to reordering, receiving and turnover trends.
Dashboards improve productivity by providing actionable insight for your data. Each one of the widgets gives you visibility into critical data and then allows you to drill down on that data to make informed decisions and to take action on those items requiring your attention.
Acumatica dashboards are designed to be flexible and easy to personalize without development expertise. You may want to move widgets around on your dashboard, adjust the sizes of your widgets, delete a widget that is not useful or even add a brand-new widget.
There are several different types of dashboard widgets supported by Acumatica, including charts data tables or listings of information, embedded pages from other websites or applications, header tiles Power BI tiles, key performance indicators through score cards and trend cards, as well as Wiki pages.
These widgets are based on information being pulled from Generic Inquiries in Acumatica and existing widgets can be modified by selecting the editing icon.
For example, here we have our top 10 overdue AR balances but perhaps I would like to modify this widget to show me the top five AR balances. In just a few seconds I can make changes to the widget properties and upon saving that widget my chart is now displayed according to the properties that we have defined.
Acumatica allows you to quickly and easily define filtering settings for your widgets. In my example, we are considering overdue balances, anything that is greater than 30, 60 and 90 days overdue. Not only can these filtering settings be modified but you can also use color coding within Acumatica to define certain trigger points.
In this example, if we have more than four customers on credit hold, we would like to use the alarm color of red. Anytime we have less than two customers on credit hold, we would like to use the normal color displayed as green.
Possibilities for key performance indicators are endless. In this example, our purchasing manager has a purchasing trends widget on his or her dashboard. We have selected the inquiry to use as our basis, which field we would like to aggregate for our trend, the function to use, as well as the period of time that we would like to look at. My dashboard will then display whether that key performance trend is rising or falling.
Acumatica dashboards are designed to be the home base for users within the system. They provide real-time visibility and insight into key organizational data; they provide drill down functionality to take action and make decisions.
These dashboards are modern and flexible and do not require development experience to modify they are also based on individual roles and responsibilities within the company.
Discover More Tips, Tricks and Other Features for Acumatica
SWK Technologies will help you get the most out of your ERP investment, leveraging our deep technological and industry knowledge as a top Acumatica partner and Community resource. Check out some of our Acumatica videos and other educational resources, and reach out to us when you’re ready to learn more tips and tricks to maximize your value return on your software.
Contact SWK here to gain access to more Acumatica tips, tricks, updates, and tailored demos.
Learn More About Acumatica Dashboards & KPIs
