Spot Problem Areas Quickly with Acumatica User Activity & Performance Monitoring
With the mass move to remote working, the systems are now the communication highway for organizations. They are the glue that keeps the team together. Today’s work-from-anywhere arrangement requires technology to help foster employee engagement and track goals to help motivate the team. While the concept is not new, the method of application and monitoring has changed for many. With that in mind, and considering recent inquiries from customers, I decided to dig a bit deeper into what Acumatica Cloud ERP can provide to help companies and their teams stay informed about activities in the system and to spot opportunities to fine-tune their systems and their teams.
Problem areas can include data processing bottlenecks and/or the need to add more resources or perform additional training or testing.
Acumatica Standard User Activity Audit Features
Included with Acumatica are several standard features that are worth mentioning before building generic inquires, pivot tables, and dashboards for a specific monitoring application. These features include Screen Audit History, System-Wide Auditing with Access History, and user configured Field-Level Audits.
Acumatica Screen Audit History
With the Row-Level Security feature enabled, users with proper access rights can inquire from within a screen to see basic audit information about the transaction.
Screen Audit Information
- Created By (user id)
- Created Through (application or screen id)
- Create On (date/time)
- Last Modified By (user id)
- Last Modified Through (application or screen id)
- Last Modified On (date/time)
Acumatica Access History and System-Wide Auditing
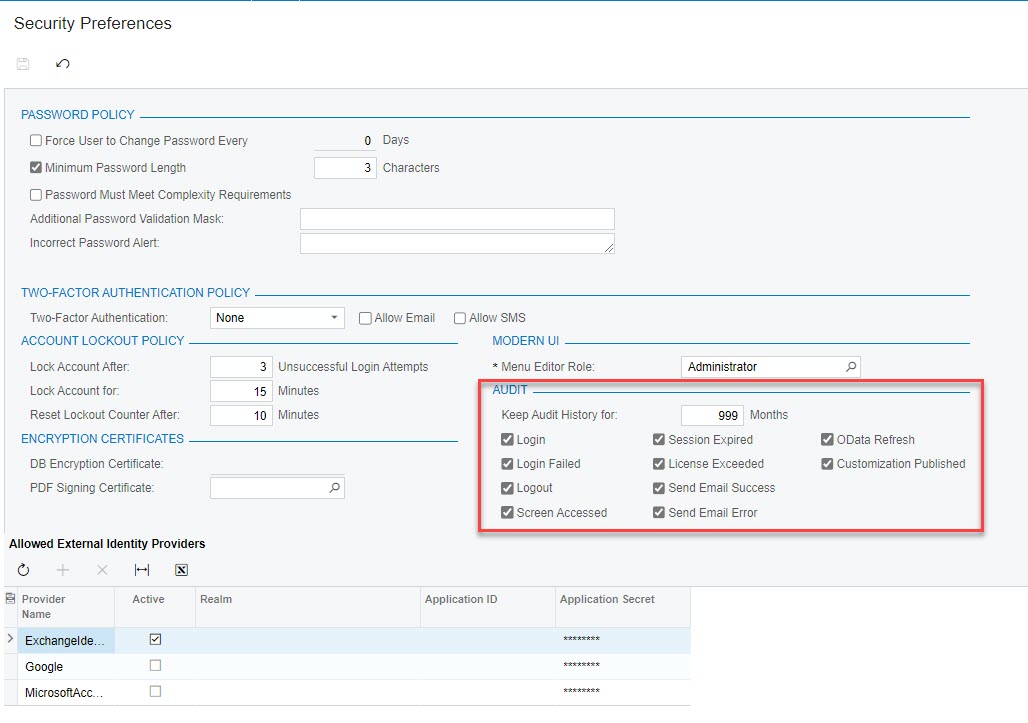
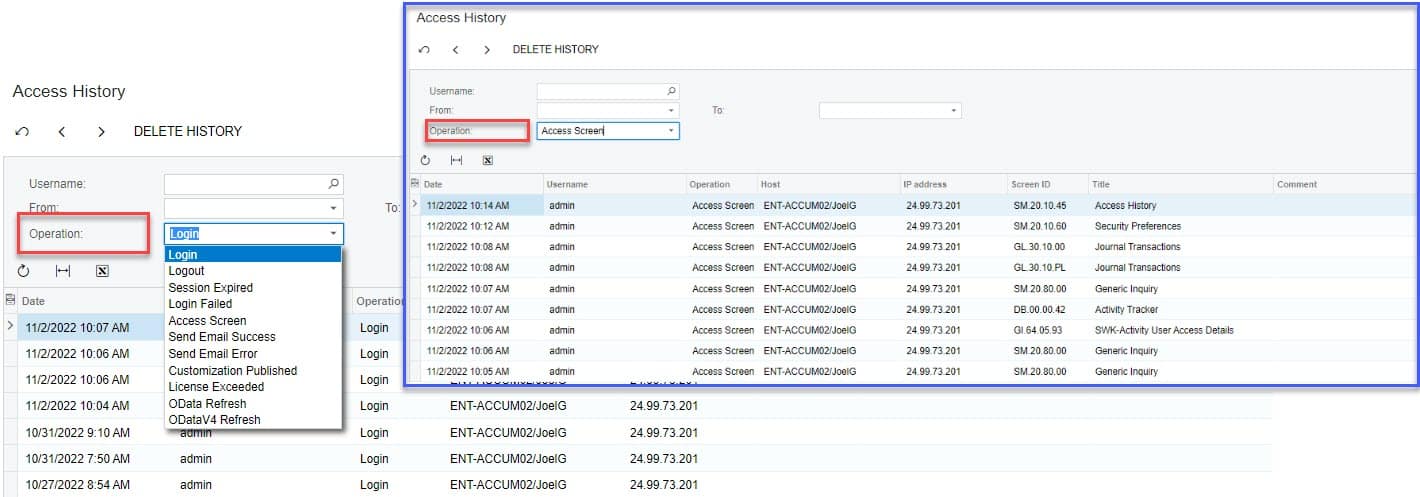
Acumatica Cloud ERP deploys with the standard audits activated and the results of those audits are available through the Access History screen. Users with proper access rights can configure the items to audit and audit history retention in the Security Preferences screen under the Audit section.
System-Wide Audit Information (Acumatica 2022 R2 fields – may vary for older versions)
- Login
- Login Failed
- Logout
- Screen Accessed
- Session Expired
- License Exceeded
- Send Email Success
- Send Email Error
- OData Refresh
- Customization Published
Acumatica Field-Level Audits
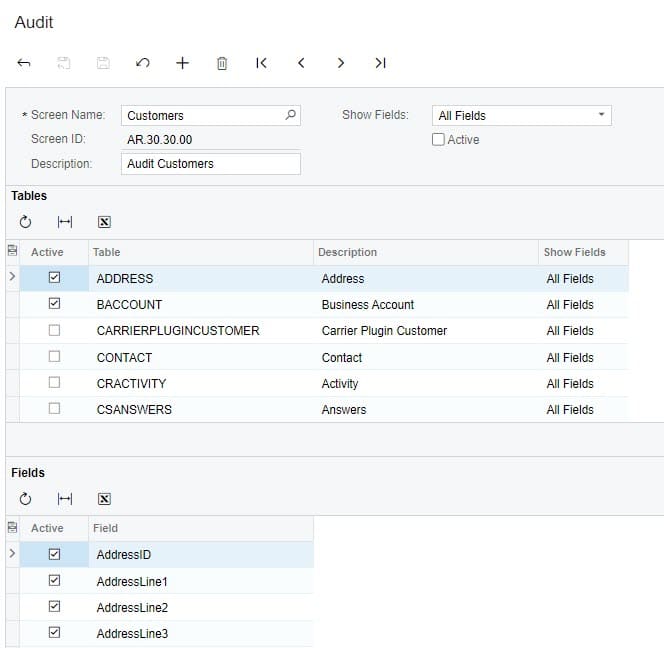
With the Field-Level Audit feature enabled, Acumatica Cloud ERP offers users the ability to configure audits designed to monitor and address identity-management concerns. The feature tracks the creation, updates, and deletion of records by maintaining a full history of transaction activity and the user initiating each activity for the selected objects (screen). Field-Level Audits are a powerful feature generally used to track key data elements like setup screens, customer accounts, vendor accounts, and key input screens.
Acumatica Pre-Production Performance Metrics
Let’s start with a step back to the implementation phase and discuss data gathering to help ensure a smoother go-live. As someone with many years of ERP implementation experience, I understand the value of an Activity Tracker dashboard that provides visibility into test transactions during the implementation. Sufficient user testing is a key element of a successful implementation and I have had my share of challenges getting users to complete testing. The goal of the Activity Tracker dashboard during implementation is to point out problem areas where sufficient volume and variety of transactions have not been tested and could lead to issues during go-live. It is also about ensuring a sufficient number of transactions have been created by the correct users.
Pre-production metrics like the Activity Tracker referenced above are more straightforward than in-production metrics which require more nuance and weighting. For Pre-Production, all transactions are weighted equally.
Pre-Production performance metrics examples
- Last Login Date by User Id
- Last Activity Date User Id
- Transaction Count by Module/Function and by User Id
Building Pre-Production Activity Tracker Dashboard
Acumatica Cloud ERP provides a host of great audit features and when properly configured, opens the door for users to utilize standard Acumatica tools like generic inquires, pivot tables, and dashboards to enhance the reporting and visibility to meet your organization’s goals.
Let’s start by deciding what is important to track for a typical Acumatica Distribution Edition customer and then we can move on to building the generic inquiry and/or pivot table and the dashboard.
Pre-Production Activity Tracking Metrics
- Pre-Production / Testing
- Logins
- Last Login
- Last Screen Access
- Financial Module Transactions Counts
- Accounts Payable
- Count by Document Type by User
- Report Usage
- Accounts Receivable
- Count by Document Type by User
- Report Usage
- General Ledger
- Count by Transaction Type by User
- Report Usage
- Distribution
- Purchasing
- Count by Document Type by User
- Report Usage
- Sales Orders / Shipments
- Count by Order Type by User
- Count by Shipment Type by User
- Report Usage
- Inventory
- Count by Transaction Type by User
- Report Usage
- Purchasing
- Accounts Payable
- Logins
Pre-Production Activity Tracker Generic Inquiries
In Acumatica Cloud ERP, the dashboards display the data that is prepared in Generic Inquiries. Before we can display the data in a dashboard, we need to build the Generic Inquiry the renders the metrics we are seeking. The following are three examples of gathering basic tracking information that can be used to build out your tracking across multiple modules.
User Last Login and Last Activity Date
The user login and last activity are stored in the PX.SM.Users table. It is the only table needed in this Generic Inquiry as it includes the source data and the reference needed to add the dashboard filters by Username. I set the caption on the Username field to Username otherwise it will default to Login. I used the Username as the dashboard filter value and like to keep the naming consistent.
Accounts Payable Document Count by User
The Accounts Payable document count by user data is stored in the APInvoices table which represents AP Invoices, Credit, and Debit Adjustments. The DAC is based on APRegister and appears to extend it with data for Credit and Debit Adjustments.
Generic Inquiry Structure
- Tables
- PX.Objects.AP.APInvoice
- PX.SM.Users
- Joins
- APInvoices.CreatedByUserId = Users.PKID
- Grouping
- APInvoice.CreatedById
- APInvoice.DocType
- Fields
- APInvoice.RefNbr
- Caption: Count
- Aggregate Function: COUNT
- APInvoice.DocType
- APInvoice.CreatedById
- Users.Username
- Caption: Username
- Visible: No
- APInvoice.RefNbr
Accounts Payable Report Usage
The Accounts Payable report usage required a bit of creative thinking and some assumptions. I was not able to find a table that clearly labeled an object as a screen, report, or generic inquiry. I did find a reference in the SiteMap.URL to the word ‘Report’ and the word “GenericInquiry”. I used URL value as a Condition in the Generic Inquiry to filter down to Reports.
Site Map URL Examples
- ~/GenericInquiry/GenericInquiry.aspx?ID=15035559-bd12-47d4-b89c-542ce2995e65
- ~/Frames/ReportLauncher.aspx?ID=AM600000.rpx
Generic Inquiry Structure
- Tables
- PX.SiteMap.DAC.SiteMap
- PX.SM.LoginTrace
- PX.SM.Users
- Joins
- LoginTrace.Username = Users.Username
- LoginTrace.ScreenID = SiteMap.UserID
- Conditions
- SiteMap.Url Contains Report
- SiteMap.ScreenID Starts With AP
- Grouping
- LoginTrace.ScreenID
- Sort Order
- LoginTrace.ScreenID
- Fields
- LoginTrace.ScreenID
- LoginTrace.ScreenID_Description
- LoginTrace.Username
- LoginTrace.LoginTraceID
- Caption: Count
- Aggregate: COUNT
Pre-Production Activity Tracker Dashboard
Once you have created each of the desired Generic Inquires, you can move on to design your dashboard using a variety of widgets. In the image below, I used the table widget to display the activity. You can see that it is easy to fill up a screen so be sure to include data relevant to your goals. If you are not planning to use Purchasing then exclude the widgets. Place your high-priority items at the top. Make the dashboard user-friendly by adding a dashboard filter to display all metrics based on a single user.
Data Hole Note: Under AP Checks By User, notice there is no Document Type for 16 transactions. Digging into the data I determined these are Quick Checks for which there is no APInvoice.DocType entry. You will find a similar data anomaly in AR Documents. Once I knew the data issue I was okay with explaining it rather than programming around it.
In-Production Performance Metrics
Congratulations, you have successfully implemented Acumatica Cloud ERP and your company is well on its way to improved visibility and streamlined processing. Now the fine-tuning process begins.
In-Production, that is once the system is live, we start to look at activity as a gauge of workload and in some cases, the performance marked against goals. For the sales team this is common practice. You measure leads, opportunities and closed deals to gauge close rate and revenue contribution against which the employees are compensated.
Other areas of the company may have a slightly different view of transaction metrics. Rather than a performance indicator, it may be used as a guide for staffing or to point out opportunities to automate. For instance, if you have one AP Clerk and the number of weekly AP Bills go from 300 to 900, you may need to either add staff or invest in AP Automation to streamline processing.
The most basic activity to track is login. Activity data is useless if users are not logging into the system. User adoption can be a problem area and tracking user login activity is an important first step for a new deployment. Lack of user login can indicate the information users need to perform their job is not being provided or is not easily accessible. It may also indicate that users are relying on an alternative method of obtaining data which may not be accurate or time efficient.
In-Production General Performance Metrics
- First Login Daily by User Id
- Last Screen Access Daily by User Id
- Most used screens
- Most used reports
Data Cautions and Considerations
As with any data gathering and reporting exercise, it is important to define your goal and understand the data holes. The data holes are the gaps in the information that can lead to incorrect interpretation. In some cases, you can programmatically work around the data holes and in other instances, it requires a calibrated eyeball when reviewing the results. The data holes will likely change over time as new users are added and new data is entered into the system.
Example Data Caution Scenarios
#1: A new report has been deployed and no users have accessed the report in 20 days. The first instinct may be to think the report was not needed. The data may instead be indicating the users do not have the report on their menu or they do not have access rights to run the report.
#2: The data shows that Sam was active in the system 2 hours each day for the past 14 days. He accessed 2 screens each day. This could be an indication that the system is not delivering the information the user needs. In this case, Sam is the IT person who performs a manual snapshot. The knowledge of Sam’s position and planned activity in the system in conjunction with the report fills the data hole and indicates Sam’s activity is consistent with his role.
Data Holes to Consider
- Users generally login multiple times a day making capture of overall duration impractical.
- Idle time on a screen is not captured.
- Most users do not log out, they simply close the browser which does not create a tracking entry. This means the system is not able to clearly determine when a user decides to end their day.
- Many users do research and only view the system. They do not create transactions which eliminates the transaction count metric.
- Users work in many systems and tracking activity in a single system does not provide the full picture of activity.
- Tracking the number of transactions entered does not take into consideration quality or input errors.
- Transactions counts do not reflect complexity of the transactions. An expense claim with ten transaction lines may take longer to process than a vendor bill with ten lines.
Take time to consider the unique data holes that exist in your organization so you understand the limitations before drawing conclusions. Remember that data holes change over time as you modify configurations, introduce new users and data into the system.
Building In-Production Tracking Metrics
In-production metrics are much more nuanced than pre-production metrics. They require a deeper evaluation based on the unique goals of your company. The baseline of user logins will remain consistent though you may choose to expand the scope of data you analyze to help determine usage and usability. For our example, we will look at Accounts Payable and several metrics that may be applicable to your organization. The metric you create for the Accounts Payable module may be usable as a template of sorts, with a change in tables, for other financial modules. The following are some example metrics you may consider.
- Finance (GL/AP/AR/CA)
- Transaction Counts by Screen
- Transaction Counts against goals (e.g.: AP Bills per week)
- Complexity of transactions ranked (based on number of transaction lines and source module)
- Average Number of transaction lines by user per week
Accounts Payable Transaction Metrics
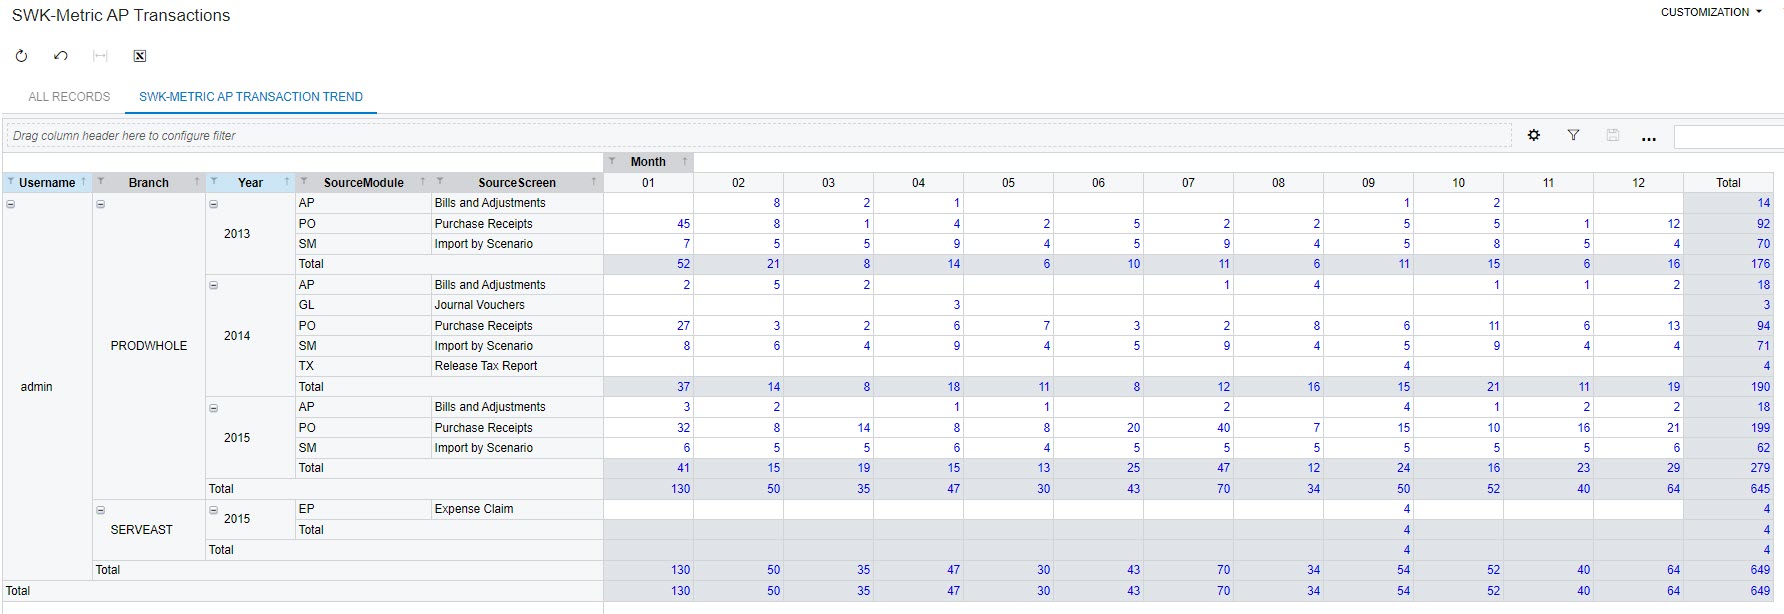
For this example, we will determine the number of AP Transaction lines per User trending by month with consideration for the source module of the AP transaction. We will use a Generic Inquiry to assemble the data and a Pivot Table for presentation.
Data Hole Note
- Using the CreatedByScreen Id value, you can determine if documents were automatically generated using Acumatica AP Document Recognition AP301110, manually entered AP301010, Imported, or from a variety of other sources. The source helps determine level of effort required to create the transaction.
- Financial Transactions will have a Debit (DR) and Credit (CR). Depending on the source module and transaction type, you will want to filter to either the DR or CR to capture the user entered portion of the transaction.
Generic Inquiry Structure
- Tables
- PX.Objects.AP.APTran
- PX.SM.SiteMap
- PX.SM.Users
- Joins
- APTran.createdByID = Users.PKID
- APTran.createdByScreenID = SiteMap.ScreenID
- Conditions
- APTran.Released = True
- APTran.DrCr = =IIf( [APTran.TranType] <> ‘ADR’,’D’, ‘C’)
- Fields
- APTran.BranchID
- APTran.BranchID_Description
- APTran.CreatedByID
- APTran.CreatedByScreenID
- APTran.CreatedDateTime
- APTran.DrCr
- APTran.FinPeriodID
- APTran.LineNbr
- APTran.RefNbr
- APTran.Released
- APTran.TranDate
- APTran.TranID
- APTran.TranType
- Users.Username
- Caption: Username
- =Left([APTran.CreatedByScreenID],2)
- Caption: SourceModule
- =Left([APTran.FinPeriodID],4)
- Caption: Year
- =Right([APTran.FinPeriodID],2)
- Caption: Month
- SiteMap.Title
- Caption: SourceScreen
Pivot Table Structure
- Rows
- Username
- Branch
- Year
- SourceModule
- SourceScreen
- Columns
- Month
- Values
- APTran_TranID
Accounts Payable Transaction Metric Pivot Table
The pivot table does a great job of filtering and displaying user transaction lines over a user specified time period. The SourceModule and SourceScreen help determine which transactions were user entered versus system or process generated. The number of transaction lines by period can guide staffing needs.
User Access Metrics Pivot Table
User login trends are a helpful metric when planning system downtime around the team’s work schedule. Your organization may have a larger number of users than my test data and will likely require a different orientation or chart type to clearly display the data. The User Access Metrics pivot table displays in military time the user trends for signon and screen access.
User Average First Login Time Trend as a Chart Widget
You now have some examples of how Acumatica Cloud ERP can present helpful metrics on user activity and transactions. Best of luck with your own unique data creation and analysis.
Learn More About Acumatica Cloud ERP Reports
SWK Technologies will help you get the most out of your ERP investment, leveraging our deep technological and industry knowledge as a top Acumatica partner and Community resource. Check out some of our Acumatica videos and other educational resources, and reach out to us when you’re ready to learn more tips and tricks to maximize your value return on your software.
Contact SWK here to gain access to more Acumatica tips, tricks, updates, and tailored demos.
See More Acumatica Features


