Need to identify your Sage X3 client process ID so you can run SQL process traces?
Today’s handy guide will show you how it’s done.
STEP 1: NAVIGATE TO THE USER FUNCTION
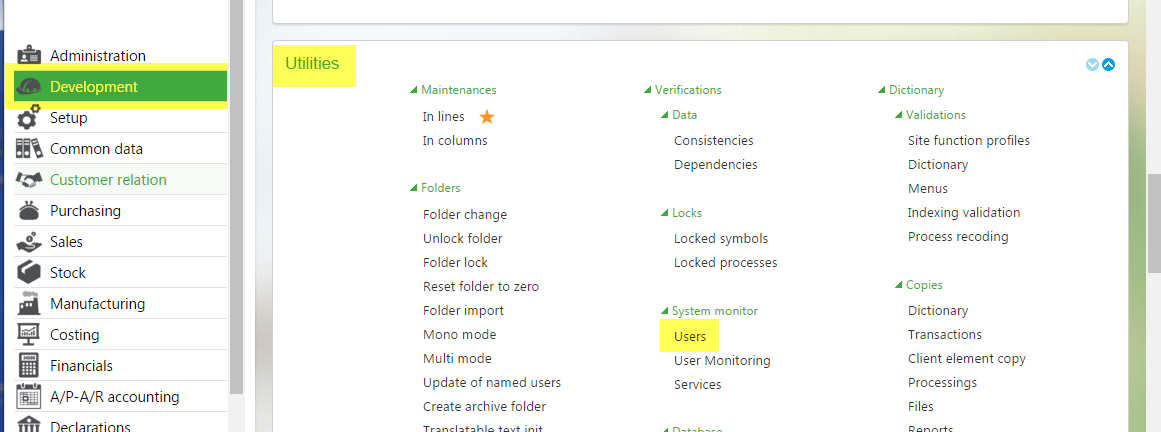
In Sage X3 you will need to navigate to the User (monitor) function – PSADX (Development – Utilities – System Monitor – Users). It will look like this:
STEP 2: CHOOSE YOUR USER
Identify the user you want to trace in SQL and find the user’s “sadoss” process number (at the bottom left of the screen). In this example, the number you’re looking for is 13072.
STEP 3: OPEN SQL PROFILER AND BEGIN YOUR TRANSFER
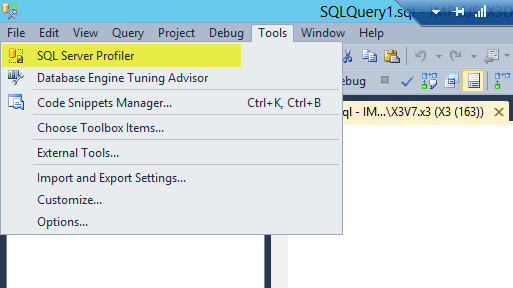
Open SQL Profiler and add the Client Process ID to the field criteria.
STEP 4: ADD THE USER TO SQL PROFILER
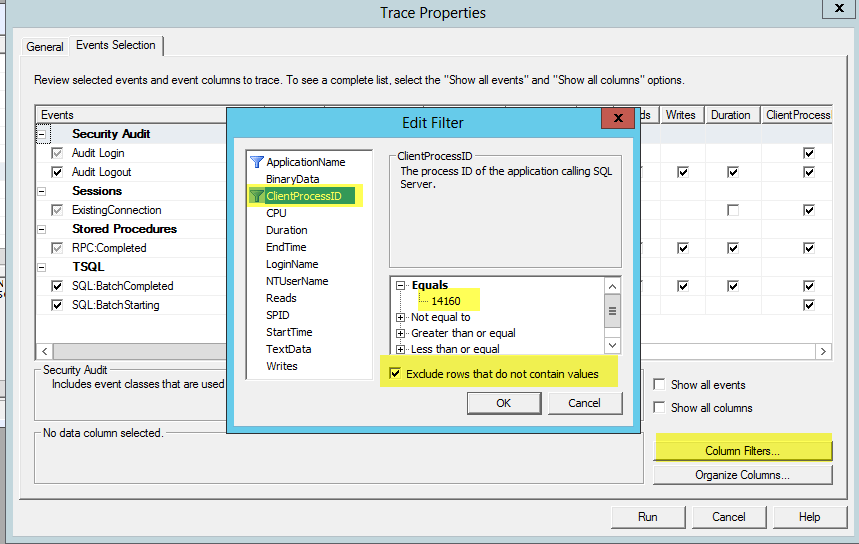
Create a new trace file and choose the Events Selection tab. Click on Column Filters and choose ClintProcessID. Enter the “sadoss” Client Process ID identified previously in the Sage X3 User (PSADX), click the box for “Exclude rows that do not contain values,” and click OK.
STEP 5: VIEW YOUR RESULTS AND GIVE YOURSELF A ROUND OF APPLAUSE
Once you’ve completed steps 1-4, you should see results similar to these.
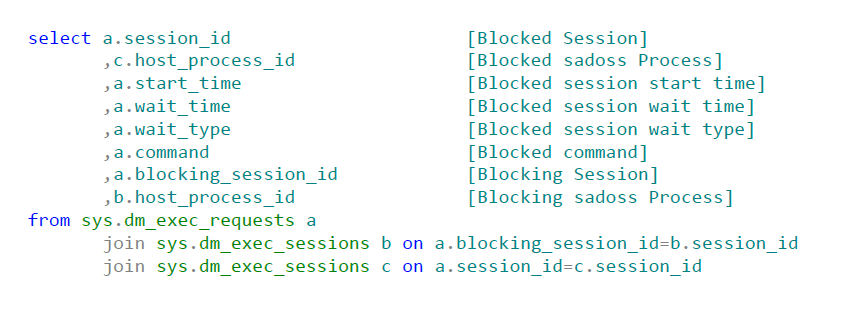
BONUS! HERE’S A SQL QUERY TO TRACK DOWN BLOCKING USING SQL:
NEED MORE HELP?
If you need assistance with this or another highly technical aspect of your software, please contact the Help Desk.
We’re happy to make your workday easier.


